The Marine Management Organisation (MMO) published its annual UK Sea Fisheries Statistics 2013 last week.
MMO’s Head of Statistics and Fisheries Management, Kevin Williamson, looks at how the information is used to ensure we have healthy and diverse seas around our coastline and beyond.
We have just released the latest report on the UK’s fishing industry, an in-depth snapshot of both the size of the UK fishing fleet and what is being caught.
So why should this matter to you? This data is essential to helping us to manage when and where species can be caught, as well as helping scientists understand the state of key fishing stocks and where extra protection or monitoring may be needed.
In our role as fisheries managers we look at the landings figures for species all through the year to watch how fisheries progress. This covers familiar species such as cod and haddock and also others like boarfish that aren’t as well known but still need our help to protect them as part of our contribution towards safeguarding the welfare of fish stocks. Our aim is to maximise fishing opportunities for the UK industry while ensuring that stocks are not overfished, and these statistics as we see them during the year really help us have a clear picture of how to do this.
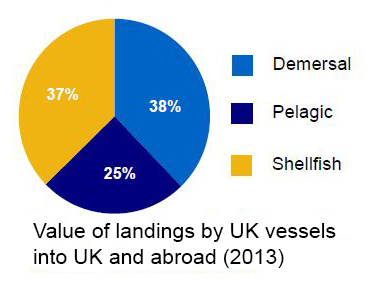
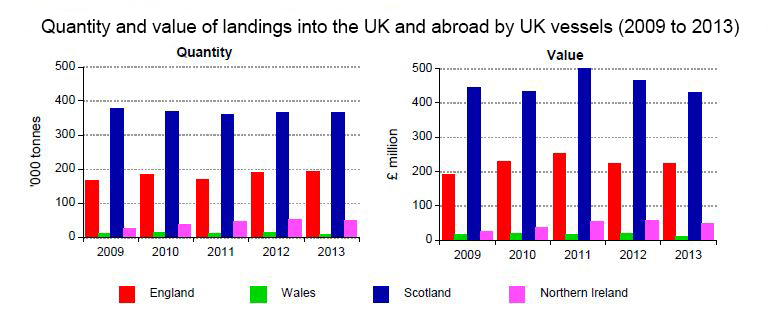
Did you know that UK vessels landed 624,000 tonnes of sea fish (including shellfish) into the UK and abroad with a value of £718 million?
We work with the fishing industry during the year to try to keep fisheries open wherever possible and to keep activity within the limits set across the EU. Our responsibilities cover activity right around the coast of England and the fisheries managers in my team, and our staff around the coast, regularly gather the views of the fishing industry to do this. We keep all of the limits we set continually under review, making changes through the year as we have to, sometimes tightening limits or closing fisheries if necessary while at the same time looking to see if we can make alternative options for fishing available.
We appreciate that providing us with this information creates a burden on fishermen. However, we work to maximise the use of the data both within government and also more widely by making as much of the detailed data that underpins the statistics in our publication available to users. Those in the industry around the coast can use it to see trends in fishing activity at their local level. For example, a drop in landings of demersal fish (cod and haddock) in Whitby between 2012 and 2013 was more than matched by increased landings of crab and scallops in 2013, suggesting fishermen are looking to diversify into other species, such as shellfish, which are not subject to quota limits.
The information on the state of the fishing industry around the coast also helps support government decisions on where it may necessary for actions to be taken to help support the industry and ensure its long term sustainability. This includes how we use government and EU funds to support the UK fishing industry. Over the last six years we in the MMO have committed over £30 million towards projects with a total cost of £98 million which otherwise would not have gone ahead.
We want to make sure this information is available to as many people as possible in a range of ways, so as well as the report and data files we release, we’ve been tweeting fish facts this week, have a Facebook album of easy-to-understand graphs and also a map of key statistics by individual ports.
Please let us know if these prove useful or you have any other comments, by emailing info@marinmanagement.org.uk